Apr 29, 2012

Why Life Cycle Funds are Second Best

Life Cycle Funds (LCFs) are seen as the ideal solution for pension planning. Unfortunately they aren't..... They're Second Best....

Pension Funds solutions (PFs), are far more superior to LCFs, as will be shown in this blog with regard to the performance of a pension plan.

Life Cycle
A Life Cycle approach presumes that, while your young and still have a long time before retirement, you can risk to invest more than an average pension fund in risky assets like stocks, with an assumed higher long term return than bonds,

As you come closer to the retirement age, you'll have to be more careful and decrease your stock portfolio incrementally to zero in favor of (assumed) more solid fixed income asset classes like government bonds.

A well known classic life cycle investment scheme is "100-Age", where the investment in stocks depends on your age. Percentage stocks = 100 -  actual age.
E.g.: If you're 30 years old, your portfolio consists of 70% stocks and 30% bonds.

Here's what the average return of a life cycle '100-Age' investment looks like when you start your pension plan at the age of 30 and assume a long term 7% average yearly return on stocks and 4% on bonds.
The return of this life cycle fund is compared to a pension fund with continuously 50% in stocks.


Key question is however, is the younger generation also risk minded and the older generation risk averse?

As often in life and also in this case, what would be logical to expect, turns out just to be a little bit more complicated in practice....

Misunderstanding:Younger people have a high risk attitude
Research by Bonsang (et al.; 2011) of the University of Maastricht and Netspar shows that on average 25% of the 50+ generation is willing to take risk.
 The research report shows evidence  that  the  change  in  risk  attitude  at  older age  is driven by 'cognitive decline'.  About 40 to 50% of the change in risk attitude can be attributed to cognitive aging.

Unfortunately other recent research also shows that only 30% of people under age 35 say they're willing to take substantial or above-average risks in their portfolios (source:Investment Company Institute).


This implies that -  although they would theoretically be better of on the long run - younger people will certainly not put all their eggs in one basket, by investing all or most of their money in stocks.

Pension Fund Investment Horizon
In contrast to individual pension member investors, a pension fund has a long term perspective of more than 20-50 years as new members (employees) keep joining the pension fund in the future. Therefore a pension fund can keep its strategic allocation in stocks relatively constant over time instead of decreasing it.


This implies that a pension fund on the long term has an advantage (longer horizon) above a life cycle fund. Let's try to find the order of magnitude of this difference.


Comparing a Life Cycle fund with a Pension Fund
First of all, we have to take into account that younger people will not over invest in stocks.

Let's assume:
  • A 30 year old 'pension plan starter', retiring at age 65
  • Contribution level   (€, $, £, ¥,): 1000 a year
  • A long term 7% average yearly return on stocks and 4% on bonds
  • Life Cycle Investment scheme
    A modest 50% stocks, with a yearly 2% decrease as  from age 50
  • Pension Fund Investment Scheme
    A constant 50% investment in stocks (and 50% in bonds)
  • Inflation 3%, Pension and Contribution indexation: 3%

 This leads to the next yearly return of these portfolios, as follows:


To find out the overall difference in return between LCF en PFS, we calculate the Return on Investments (ROI) of both investment schemes with help of the:


The outcome looks like this:

As you can see the ROI outcomes (left axis) on the investments (yearly contribution) from 'dying age' 65 to age 69 are negative as the cumulative payed pensions (compared to your contribution) didn't (yet) result in a positive balance. Or to put it in another way, if you die between age 65 and 69, you died too early to have a positive return on your paid contribution.

Overperformance
The right axis shows the difference between the LC ROIs and the PF ROIs.
As you may notice,  the pension fund has a structural yearly overperformance of more than 0.3%  and an average overperformance between 0.4% and 0.5% per year.

Overperformance expressed in pension benefits
Expressed in terms of yearly pensions the differences are as follows:


Investment SchemePension at 65Relative
LC 55year -2% p/y1167383%
LC '100-Age'1230493%
PF 50% stocks13172100%


For a 40 year old pension plan starter, the differences are:

Investment SchemePension at 65Relative
LC 55year -2% p/y535982%
LC '100-Age'557892%
PF 50% stocks6040100%


Conclusion
Investing in life cycle funds ends up in a 7% to 18% lower pension than investing in a pension fund with 50% investment in stocks.


So..., Be wise and choose a pension fund for your investment if you can!


Aftermath
Of course, every pension vehicle has its pros and cons ... So do Life Cycle AND Pension Funds.....


Related Links/Sources
- CNNMoney:The young and the riskless shun the market (2011)
- Cognitive Aging and Risk Attitude (2011)
- America’s Comm. to Ret.Security: Investor Attitudes and Action (2012) 
“Saving/investing over the life cycle and the role of pension funds” (2007)
- Excel Pension Calculator Blog
- Benny AND Boone Comic Strips
- Study: Public employee pensions a bargain (2011)

Apr 22, 2012

Investment Herding Risk

What was suspected, has now been proved:

Investment Herding Exists!

Dutch Pension Funds are active Traders
In a 2011 research document called "Herd behavior and trading of Dutch pension funds", researchers Rubbaniy, Lelyveld and Verschoor of the Dutch Erasmus University in Rotterdam, provided evidence that repudiates the popular belief that - in specific - Dutch pension funds are long-term passive institutional traders.

De facto Dutch pension funds are active traders and trade about 8.5%  of their portfolio on a monthly basis!

Conclusions
Main conclusions of Rubbaniy (et al.) are:
  • Significant feedback trading strategies, both momentum and contrarian
  • Robust herding behavior in investments of Dutch pension funds
    Overall (LSV) herding level of 8.14% (significant at 1% level !!)
    On average if 100 PFs are active in the same security in the same month, there are 8.14 more PFs trading on the same side of the market than what would be expected under null hypothesis of random selection of securities.
  • Herding asymmetry in buying and selling of securities
    Across asset classes there is a higher degree of herding in less-risky assets.
  • Recent financial crises have a positive impact on both turnover and herding while it negatively affects feedback trading.


Explanations
Possible explanations of these herding effects are:
  • Possibly outsourcing of portfolio management and small PFs imitation of large PFs’ lead to the same kind of asset allocation strategy.
  • Many small Dutch PFs often hire the same large and reputed asset management firms for their portfolio management and are likely to have same asset allocation of their portfolios. 
  • Even if they do their own portfolio management, small Dutch PFs may mimic the investment behavior of large PFs - a widespread belief about the small investors - and thus, add to (LSV) herding measure.

Remarks
Let's conclude with some remarks....

  • Dangerous Big Brother Hedge
    Although large PFs (investors) have some 'economics of scale' and budget for experimenting on a small scale with (alternative) non-conventional investments, their investment strategy probably strongly differs from a small PF, as liabilities, sponsor obligations and pension benefits conditions are often are fund specific. 

    Therefore, following a large PF asset strategy as a small PF, is extremely dangerous and will eventually not turn out to be the 'big brother hedge' the fund was aiming at.
     
  • Unfounded First Mover Risk
    Key question remains if all this herding, hedging and active trading results in an outperformance above a long term sustainable asset-location strategy.

    Probably not. But although investors pretend tot act on a rational basis, in reality irrational and conformist behavior take the upper-hand. Small investors often don't dare to formulate a unique fund specific asset allocation strategy because of 'first mover risk'.

Keep care and formulate yur own specif pension fund strategic asset mix!

Related Links & Sources
 - "Herd behaviour and trading of Dutch pension funds" (2011, PDF)
 - Momentum or Contrarian Investment Strategies:
    Evidence from Dutch Institutional Investors (2011)
- Momentum and Contrarian Stock-Market Indices

Mar 30, 2012

Excel Pension Calculator

Why isn't there just a simple pension Excel calculator on the internet, so I can do my own pension planning?

Well..., from now on there is!

Simply download the Excel Pension Calculator (allow macro's !!) and get an idea of how much you'll have to invest to end up with the pension benefit level of your dreams.... or less... ;-)

Or..., just fill in how much you can afford to invest monthly and see for yourself what pension benefit level is within reach, based on expected return rates, investment methods and inflation.

Just to give a small visual impression of the calculator...


Press on 'Calc' buttons to calculate the variable to the left, while leaving all other variables constant.

Graphics
Also some modest graphics are available. A small example....
Take a look at the next graph that shows how your yearly pension is yearly  funded by:
  1. the yearly desavings (= dissavings) from your saving account
  2. the yearly addition from the pension fund (= estimated savings of pension fund members that will die in this year)
  3. the yearly return on your saving account


Notice the immense impact of the (yearly increasing) addition of your pension fund (= savings of the active members who are expected to die in a particular year and contribute to the savings of your account) compared to the other components (desavings and returns).

Options
The calculator offers several interesting options:
  • Set the calculator to 'Saving Account' instead of 'Pension Fund' to notice the difference in outcomes between these two systems.
  • Switch to the life table of your choice (p.e.  the country where you live)
  • Set and name your own personal Life Table or Investment Scheme
  • Simulate longevity effects by manipulating the Life Table Age Correction field

The Excel Pension Calculator has much more features. More than I can handle in this blog. Just download the calculator and play with it to really touch base and to learn what pension is all about....

- Download the Excel Pension Calculator


Enjoy!

Disclaimer: This pension Calculator is just for demonstration purposes. The accuracy of the calculations of this calculator is not guaranteed nor is its applicability to your individual circumstances. You should always obtain personal advice from qualified professionals. Also take notice of the disclaimer in the Excel Pension Calculator.

P.S. I : On request a Quick Start tip
1. Download Calculator and open Excel Spreadsheet
2. Don't forget to"Enable Macros" !! 
3. Enable iterative calculation; Set Max. Iterations=1000, Max. Change=0.4
3. Change 'Start Age  Contribution' to your actual age
4. Notice that the amount 'Saving Surplus at age 120:' changes
5. Press the 'Calc' button next to 'Contribution' to calculate your Contribution
6. Or, Press the 'Calc' button next to 'Pension'  to calculate your yearly pension
7. Set any other Field as you like and press any of the 'Calc' Buttons   

P.S. II : New update, version 2012.2 on April 4,  including a single premium option.
P.S. III: New update, version 2012.3 on April 20, drop down menus (under Excel-2010) now also operate under Excel-2007 versions...

Mar 14, 2012

Life is Nonlinear, so is Risk!

From the day we were born, we've learned to survive in a complex world by applying linear mechanisms in life:
  • On a short time scale things don't change much
  • The future can be predicted by extrapolation of the past
  • Every event now, must have a cause in the past
  • Results are a (linear) combination of events in the past

Linear Thinking
In line with our linear culture, we - actuaries, (risk) managers, investment consultants or asset managers, etc. - have applied this way of linear thinking in our professional field:
  • Mean reversion: Returns continue to go back to an average value over time
  • Volatilities are more or less constant in time
  • Increasing volatility is a good predictor of an upcoming financial crisis
  • Standard deviation is similar to risk or volatility
  • If a distribution is complex, a normal distribution nevertheless will do fine
  • Tail risks are not really interesting or can't be modelled anyway

More detailed psychological linear thinking in the Risk area...

  • Peer Risk: If all other professionals (institutions) are using a certain method or investment strategy, why should I take the risk of developing a new one?
  • First Mover Risk: Why should I act first and carry all research investments?
  • Supervisory Compliant:If the regulator prescribes new regulations, I'll apply those regulations as if it is my own risk appetite.
  • Big Brother Hedge Risk: I base my investment strategy at a save distance on the biggest leader in the market. Might trouble arise, the Regulator first has to deal with my Big Brother.
  • Regulation Risk: Regulation (change) is perceived as a given fact and not viewed or managed as a kind of risk
  • Risk of Free Rate Risk: There must be some kind of risk free interest rate.

Thinking long term and two steps deeper, it's obvious that applying any of the above mentioned linear thinking methods will likely be the nail in the coffin of any financial institution.

Linear thinking and modelling make our daily life more simple. Unfortunately, 'too simple' to cope with financial markets reality on a long term. 

Metamorphosis by Escher...
If we are lucky, (market) circumstances only change slowly and we're able to adapt the value of the variables in our linear models gradually, while  keeping our traditional way of linear thinking and modeling.  We act just like the famous graphic artist Escher shows us in Metamorphosis...

If we are less 'lucky' (as we are in2012), our linear models all of a sudden seem to fail. Covariances and volatility increase. Systemic risk shows up everywhere and a 'risk free rate' turns out to be an illusion. Our risk dashboard is on fire and we'll have to admit: our linear MPT models are failing.


Navigation Risk Parable
Why is it so so hard to admit that our linear models fail?

Suppose you developed a 2D linear (x,y)-navigation app in your Florida flatland office. Your app works fine for years. Than you decide to visit Black Hills & Badlands of South Dakota. Suddenly your app seems to fail in the mountains. Travel times and distances on your display suddenly seem wrong.

You realise you urgently need to develop a nonlinear 3D (x,y,z)-navigation app.... However, you don't do it.

Why not?

Well, first of all your old linear 2D app worked fine for years and on short trips the app still works (approximately) fine.

Besides, nobody of your Californian friends uses a 3D app and developing a new nonlinear app is very expensive.

Well, it's time we realise that most developments in life are in fact nonlinear.
If the stakes are high, like in the investment business, linear models will eventually lead us to a disaster.

Summarised, we might conclude:

If life is Nonlinear, so why aren't our models?

New Solutions
What alternatives do we have for our old linear model?

Although there are many nonlinear models, I'll emphasize on two interesting nonlinear based models in this blog.

I. Predicting economic market crises using measures of collective panic
Is there an adequate predictor of a market crisis?

Using new statistical analysis tools based on complexity theory, the New England Complex Systems Institute (NECSI) performed a new research on predicting market crashes.

As we know volatility is a measure of risk. So one would expect an increase of volatility also to be an adequate predictor of a financial market crash. Unfortunately this is not the case, as is shown in the recent NECSI study. While volatility increases at the beginning of a crisis, it is unreliable as an adequate indicator of a nearby market crash.

What also is not true, is that a market crash is often triggered by market panic justified, or not justified, by external (bad) news.

The NECSI research indicates that it's the internal structure of the market and not an external crises, that's primarily responsible for a market crash.

It turns out that the number of different stocks that move up (U) or down (D) together is an indicator of the mimicry ( 'collective flight'; herding) within the market. When mimicry is high, many stocks follow each other's movements.

This "co-movement" of stocks  is an indicator of a nervous market that is ripe for panic. The existence of a large probability of co-movement of stocks on any given day, is a measure of systemic risk and vulnerability to self-induced panic.

So, rather than measuring volatility or correlation, the fraction of stocks that move in the same direction turns out to be a successful predictor of a market crash..

NECSI researchers showed that a dramatic increase in market mimicry occurred during the entire year before each market crash of the past 25 years, including the recent financial crisis.


II. Worst-Case Value-at-Risk of Non-Linear Portfolios 
We all know that VaR lacks some desirable theoretical properties:
- Not a coherent risk measure.
- Precise knowledge of the distribution function is critical
- Non-convex function of w → VaR minimization intractable
- To optimize VaR we have to resort to VaR approximations
- Normality assumption is unrealistic → may underestimate the actual VaR.

Zymler, Kuhn & Rustem of the Department of Computing Imperial College London now developed a nonlinear alternative for VAR, called


Worst Case Var


Two variations on WCVar lead to practical applications:

  1. Worst-Case Polyhedral VaR (WCPVaR)
    A polyhedral VaR approximation for portfolios containing long positions in European options expiring at the end of the investment horizon

  2. Worst-Case Quadratic VaR (WCQVaR)
    A suitable VaR approximation for portfolios containing long and/or short positions in European and/or exotic options expiring beyond the investment horizon.

Here's an example of WCQVar's results against  WCVar (plain) and the good old 'Monte Carlo Var' we mostly use in linear modeling. This graph needs no further comment.....


Using the WCQVar leads to more realistic modeling results. WCQVar-techniques can also be used for for index tracking leads to spectacular results (see pdf).

Worst-Case Value-at-Risk of Non-Linear Portfolios

Finally
After so many years of relative successfully using linear models, it's hard to recognize that we need new models based on new nonlinear approaches.
Therefore we need 'first movers'. Who's willing to take the risk and jump into the nonlinear deep-sea?


Be confident and stay on your happy feet.. after a successful jump, 'herding theory' tells us others will follow...


Sources & Related Links
- Predicting economic market crises using measures of collective panic (PDF)
NECSI Research (2011)
- Self-Induced Panic And The Financial Crisis 
- Worst Case Var Document (PDF; 2011)
- Worst Case Var Document (PDF;2009)
- Order Happy Feet Video 


Mar 4, 2012

EU: Risk Management Alert!

As faithful risk managers and actuaries, we got used to act in a compliant and regulated governance environment. While we are doing our work like buzzy bees, above our heads a disastrous and horrific risk management game takes place, it's called:

ESM

In order to end the European financial crisis, a new intergovernmental organisation, the 'European Stability Mechanism' (ESM), will be set up in Luxembourg under public international law .


Euro member countries already agreed and are now waiting for an approval of the EU-countries'  parliaments. The latest version of this ESM treaty has been signed on 2 February 2012 and is scheduled to enter into force on 1 July 2012.

The first ESM guarantee layer has been set at € 700. Here are the sustainable shareholders:


ESM Power & Effects
The ESM severely confines the economic sovereignty.

It violates democratic principles of its member states and provides extensive powers and immunity to the board of ESM Governors without parliamentary influence or control.

It's remarkable and unintelligible that even the European Parliament has no control over the ESM!

In short the power and effects of ESM as defined in the ESM 2012 document, are:

  • ESM may demand an unlimited amount of money from European countries (9.1 and 9.2)

  • In case of a demand, countries have to pay within seven days, without any negotiation or discussion. (9.3)

  • ESM is not accountable for what happens to the money; they’re allowed to make high-risk investments. (24.3)

  • ESM has the power to reduce private customer savings of bank accounts cross country without permission of the countries' parliaments or any interference from the countries' governments. (12)
    In accordance with IMF practice, in exceptional cases an adequate and proportionate form of private sector involvement shall be considered in cases where stability support is provided accompanied by conditionality in the form of a macro-economic adjustment programme.

  • There are no compliance or control measures defined with regard to ESM. Further, ESM has no targets, cost-limitation and enjoys complete immunity. (32)

  • The ministers of Finance will take a seat in the ESM Board of Governors. There they will receive a salary exempt from taxes.

  • The money supplied by all European countries will be used to save mainly the large (too big to fail) France and German banks with loans in weak European countries like Greece, Portugal, Italy and Spain. The people in those countries will not benefit at all from the money supply.


Netherlands Court of Audit Alert
The president of the Netherlands Court of Audit has written an alert letter to her Euro area colleagues and the president of the ECA regarding this new treaty. The aim of the letter is to contribute to the preparation of the next ESM-meeting of Euro area SAIs on 14 March 2012 in Bonn.

The letter addresses the next shortcomings:
  • There is no reference to the use of international audit standards in audits by the Board of Auditors
  • The different types of audit that should be possible for the Board Of Auditors – regularity, compliance, performance, risk management – are not explicitly mentioned
  • The possibilities for open dissemination of audit results by the Board of Auditors are limited. The Board of Auditors can establish one annual report,which the Board of Auditors cannot send itself to national parliaments and SAIs. This has to be done by the Board of Governors. 

It's clear that it looks fishy.....


Conclusion
Let's hope our parliaments will show some governance sense before it's

too late....

Otherwise most of European people's savings will eventually be used to fill the endless financial gap of those European countries that are not able of mastering their own financial future....

And how many countries will that be?????

Links/Sources:
- ESM 2012 Documen9 (English)
- ESM 2012 Document (Dutch)
- Austria: Objections and Reservations to ESM 
- The EU architecture to avert a sovereign debt crisis (2011) 
- ESM: Technical (PDF/PPT)
- Alert Letter Netherlands Court of Audit 
- Interview (Dutch audio) with Albert Spits

- Dutch protest

Aftermath...


Feb 19, 2012

Pension Cuts, Why?

So here we are in the 21st century of 'Pension cuts'. How could this happen and can we do something about it?

No flood of words in this blog, more staccato text and illustrations.

Let the images do their work......

Risk Management
is all about
'getting the picture'

instead of endless calculation and deliberation.

Cappuccino
Let's start with comparing your pension with a cup of coffee......

- Most Pension agreements started in the fifties and sixties of the 20th century
- Employees were promised a nominal pension (plain coffee, so to speak)
- Any additional returns meant indexation (steamed-milk in your coffee)
- Fabulous returns in the seventies and eighties made (full) indexation possible
- The idea of 'free indexation' caught fire
- Cappuccino = Coffee + steamed-milk = Nom. Pension + Indexation, was born
- Common opinion, Science up front, started to redefine our pension concept...
- Credo: 'Pension is only pension if it's "Real Pension" (indexed)  
- The 21th century's first decade returns made it clear: no room for Indexation!
- Things (returns!) got worse; Stock markets underperformed, Low Bond rates
- Nominal Pension under pressure: Pension cuts seem inevitable

Key question: How to cut pension rights?

  1. Cut Nominal Pension and keep room for Indexation?
  2. Cut on Indexation as much as possible, before cutting Nominal Pension?


Return wrap up
Looking backwards at 10Y T. Bonds and Stocks (S&P 500) as an example, this is - in short - our 'back-up' challenge for the future :

Table 1

PeriodAverage Arith. ReturnsRisk (Standard Deviation)

BondsStocksBondsStocks
1960-19804.04%8.06%5.39%15.95%
1980-200010.21%18.38%11.14%12.51%
2000-20117.56%2.37%8.39%18.45%


PeriodAverage Compound Returns

BondsStocks

1960-19803.91%6.82%

1980-20009.64%17.69%

2000-20117.22%0.53%

In addition, due to implementing Market Value Principles in the nineties and later, Bonds have become more risky on the balance sheet.


To paint the dilemma of pension funds even more,
- actual artificial low interest rates (how long?)
- extremely overvalued stock market (Total Market Cap/GDP=95%)
- increasing covariance of asset classes in times of crisis
- systemic risks everywhere
- worldwide unsure economic outlook
- unregulated and non transparent hedge and debt markets
- unidentified risk in derivatives; central clearing on its way
- upcoming unsure supervisory legislation (e.g. Solvency)

make it very hard , if not impossible, to take sustainable underpinned decisions.

To illustrate the investment part of this dilemma, take a look at the next chart:


Confidence Level
As a consequence of the above development (and longevity effects) our pensions got screwed up.

In short the next chart illustrates what happened to the (1 year) confidence level of our pensions on basis of the historical returns and risks as defined in
Table 1 on basis of a 'Return Portfolio'  approach:


The above chart clearly shows that our initial cautious (Nominal+ Pension) approach in the sixties, was replaced by an (retrospective) much too optimistic (Real Pension) belief in the eighties and nineties. 

A real pension objective puts the nominal pension at risk
Even more important is to realize that - as the approach 2000-2011 shows - it's only (questionable) possible to achieve a kind of Real Pension (with a corresponding substantial (needed) return of 5% or more) by putting the Nominal Pension (extra) at risk!!!!

More in detail:

Long term view
Looking not just at '1 year return risks', but also at 3 and 10 year return risks, we may conclude the risk of underperformance is still substantial.


Therefore, the challenging question  that still remains, is:
Is it wise to put our 'nominal pension' at substantial risk to achieve a highly unsure real pension?

Outlook
Mean Variance analysis in historical perspective, gives food for thought....
The 2012-2020 outlook seems tricky and is not directly showing a 'shiny future'...

Some remarks...
  • Last decade+ (2000-2011) with higher Bond than stock returns (see Table 1), shows a  major optimizing problem
  • Future approach (2012-2020) is based on the current low 10Y Bond rate of about 2% (SD=8%), which will keep low as a result of the FED's low rate strategy,  and low expected stock returns of about 4% (SD=16%). 
  • Even if the outlook returns would be slightly higher, this wouldn't change the picture..... 

Investment Management: What a fool believes
As  risk or investment manager these are challenging times. Perhaps the only truth in investment land is:  What a fool believes


But what a fool believes ... he sees
No wise man has the power to reason away
What seems ... to be
Is always better than nothing
And nothing at all keeps sending him


NB All (above) calculations, tables and charts are indicative and strongly simplified to make it possible to 'get the picture' and 'get feeling for the direction', in order to support complex decision making  without straying too far from reality..... 

Related Links:
- Gold-plated pensions lose shine (2012)
- Where Are We with Market Valuations? (2012)
- Value-at-Risk: An Overview of Analytical VaR (JPM)
- Solvency II nightmare still looms but worst-case scenario averted


Spreadsheets (Raw, download):
- Real ambition
- Risk Return

Feb 12, 2012

What became of my Pension Plan...

It's sad but a bitter reality, pension cuts are on their way....

We have to admit.., our once so ambitious pension plans got shattered.

What's left is the cartoonized view of an average pension member:


Dutch Perspective
For Dutch pension members and pensioners the situation has become (extra) paradoxical.

Top consulting firms like Mercer and Towers Watson (regularly) rank The Netherlands as one of the best pension countries ever.....

These announcements only bring little consolation......

On top of the Dutch State Treasury Agency illustrates the relative 'strong outlook' of the Netherlands in European perspective.

All this looks quite hopeful, but does it generate the necessary trust?


New Risk Management Definition
What comes to mind is: was our our pension plan based on hope or calculations we can trust? Is our (Dutch) country recovering plan based on underpinned facts and actions or is it 'pink cloud thinking'.....?

Hmmmmm...., all these reflections lead to a kind of new mathematical definition of Risk Management:

Risk Management = Trust - Hope

In other words, Risk Management is managing the difference between Hope and Trust......

Faith alone seems not enough.....


What's next?

Key question is in all this pension fuzz is of course: How could this happen?

More technical details in my next blog on Actuary-Info :

Pension Cuts, Why? 

Mean time, keep breathing, you're living a longer live......


Sources/Related Links:
- Dutch State Treasury Agency (2012)
- Global Pension Assets Study 2012

- The Melbourne Mercer Global Pension Index (2011)
- List of Top Consulting Firms 
- Is Faith Enough? 

Feb 4, 2012

World Roulette

This decade of quantum reality and quantum risk must have been foreseen by Charles Dickens:

It was the best of times, it was the worst of times, it was the age of wisdom, it was the age of foolishness, it was the epoch of belief, it was the epoch of incredulity, it was the season of Light, it was the season of Darkness, it was the spring of hope, it was the winter of despair, we had everything before us, we had nothing before us, we were all going direct to heaven, we were all going direct the other way - in short, the period was so far like the present period, that some of its noisiest authorities insisted on its being received, for good or for evil, in the superlative degree of comparison only.

Charles Dickens,
English novelist (1812 - 1870)
, A Tale of Two Cities


Applying Dickens' wisdom to Europe: Europe will break up, Europe will survive.......    Who knows?

Let's dive a little deeper to find out what's happening.

Different interests
First of all different countries in Europe have different interests in the outcome of this debt crisis as the next charts (2010 data) of the Telegraph (nov 2011) show:


Update
It's hard to get actual data on this subject (how about transparency?), however the 'Deutsche Bundesbank' opens up a bit, as the next table shows:

This table (3) clearly shows that Germany is increasingly funding the poor (default) positions of a number of countries.

Countries like Ireland, Greece, Portugal and Spain are in an extremely difficult and hopeless position.

Even France is 'on the wrong side' and moving in the wrong direction.....

As long as these bad performing countries are not showing any progress in getting their national finance under control and diminishing their debt, other countries like Germany, Luxembourg and The Netherlands are  throwing the money of their citizens into the bottomless pit of countries that can't take care of themselves.

As long as Europe cannot force individual member states to take appropriate measures, it's on a on a collision course and will eventually default.


For years now, Germany is putting a lot of energy and - even more - financial support in keeping Europe alive.

Despite this laudable way of acting, it's clear that if other countries don't catch up, the end of Europe is in sight.

The most horrible scenario is of course: a major (hyper)inflation in Europe.

Therefore, Germany, Luxembourg and The Netherlands would be wise to finance other countries only on basis of inflation-indexed-loans.

This way countries can't escape by means of (stimulated)  inflation.


Different types of roulette
The situation above is like a desperate German player in a casino in a lonely town.......

His European family lost a fortune that night....

In order to 'save' his family, he takes his 'responsibility' and decides to play 'double or nothing' by putting all his money on 'red' and hope for the best.

Meanwhile, his family continues to gamble on the other casino  tables, as if nothing has happened.

As Germans can calculate like no other, our Bundes-player knows he eventually can not win at roulette. But he has to play to prevent a family default.

Unfortunately, the German player doesn't realize he's not playing 'normal' European roulette, based on one green pocket.......

NO.., it's getting worse.......

Our German player is not even playing American roulette, with two green pockets and (therefore) less chance of winning.....

In fact our unlucky German friend is playing a kind of 'World roulette'..... as this inevitable European Debt Game will infect the world economy....

In 'economic practice' the situation is more risky than at the roulette table, as with roulette you can exactly calculate your probabilities, while in 'real life' you are not sure of your probabilities.

That's what Risk Management is all about, isn't it?

Keep following Europe the next months, as this story will continue.....


Next blog.... better news! 

Sources/Related Links:
- DBB:Euroland's hidden balance-of-payments crisis
- Bundesbank sinks deeper into debt saving Europe

- Bank exposure data (Bank for International Settlements, table 9D)
- Debt as percentage of GDP and total debt (Eurostat).
- ECB Stats

Jan 18, 2012

Interactive Map Charts

Remarkably interesting interactive charts at Chartsbin.

Just some examples:
- Press on 'Key' to toggle descrition square
- Press on Big Screen to view more details


1. Current World Life Expectancy at Birth

via chartsbin.com

2.Body Mass Index (BMI) by Country


via chartsbin.com


Want more chart examples with dropdown-menus for non-IE-users...?

Click Here


It's also possible to
- Embed Chartsbin charts in your Powerpoint presentation!
- Search voor Chartsbin charts

Enjoy!

Jan 17, 2012

Pensionpoly

Brainteaser...... What skills do you need to manage a pension fund?

Whatever brilliant your answer, I'm sure that the 'art of playing Monopoly' wasn't a part of it.

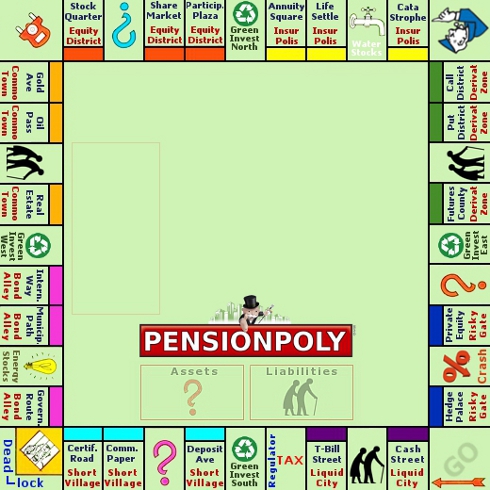
Yet, playing Monopoly and managing a pension fund  [ let's call it Pensionpoly] have a lot in common nowadays.


The main difference is that with Monopoly you can actually calculate the probability you land on one of the forty squares, while in Pensionpoly you THINK you can calculate the probability of the return of a certain asset class.

The similarities between Monopoly and Pensionpoly are that while executing a certain buying strategy (whether houses, hotels, stocks, bonds  or other asset classes), the  - short term - outcome also depends on the (financial) effects of the squares we land on and on a number of uncertain events as a result of drawing  Chance and Community Chest cards.

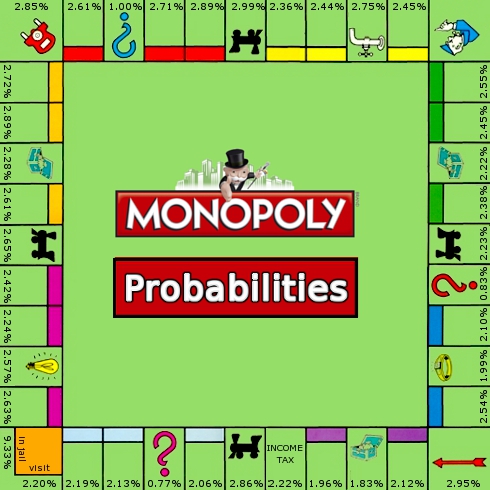
Monopoly probabilities
As described by Jörg Bewersdorff, the probability of landing on a particular square, basically can be calculated either on basis of Markov Chains or by means of applying the famous Monte Carlo method.

As an example here's the outcome of lending on a particular square on basis of a Monte Carlo simulation (more than 60.000 observations).


What's striking is that there's a 9.3% chance of ending up in jail.....

Of course, playing Monopoly takes a lot more than just calculating the probability on which square you'll be landing. Some excellent calculations have been made by Truman Collins (2005) , that include:
  • Long term probabilities for ending up on each of the squares
  • Expected income per opponent roll on all properties and other squares
  • Expected number of opponent rolls to lose or recoup mortgages

Pensionpoly
Back to Pensionpoly.... 
You can now practice you skills in playing Pensionpoly by downloading the Pensionpoly board game here.

Unzip (no viruses) the download (2Mb) file, click on 'Monopoly.exe' and start playing Pensionpoly in a minute.


Playing Pensionpoly is like playing Monopoly, with the following main differences:
  1. Cities are replaced by Asset Classes  
  2. Streets are investment categories in a certain Asset Class
  3. 'Buying Houses' is replaced by hiring (buying, appointing) Fund Managers (F-Managers); 
  4. Five Fund managers make no Hotel, but a Fund Team (F-Team)
  5. Chance cards are replaced by Asset (chance) cards
  6. Community Chest cards are replaced by Liability (chance) cards


Pensionpoly is a nice example of what is called Gamification. More info about  this subject on Pension Gamification.....

Have fun playing Pensionpoly and don't forget to play normal Monopoly with this application as well !


Sources and related links
- Bewersdorff: Monopoly in the view of mathematics (2002)
- German: Monopoly im Blickwinkel der Mathematik
- Collins: Probabilities in the Game of Monopoly (2005)

- Create your own Monopoly at Parkeeerbonnen (Dutch)
- Direct download Monopoly from Parkeerbonnen
- Markov Chains and Monopoly (Scribd)

- 18-karat solid gold Monopoly set (Museum of American Finance)

Download
- - Download Pensionpoly (zip file)

Jan 2, 2012

Risky and Happy 2012

A happy new year to all Actuary-Info readers!


While actuaries and other risk mangers are still trying to cope with 'real' (btw: what's really real?) risks, a lot of other people are still worried about the risk of risks:
The end of the world

as (assumed) predicted by the Mayans!

Maya Calendar Explained
Consult Cathryn Reese-Taylor (program director, department Archeology University of Calgary) (or read this link) for who's interested in the interesting explanation behind the end of the Maya calender.

In short, it turns out that 21 December 2012 is simply the end of the 13th baktun, a period of roughly 5200 years that the Maya used as a period-unit for counting time. Just like we in our culture use millennial periods for constructing time.

Besides this fact, the Maya predicted other events far into the future, well beyond 2012. Problem solved!

2012: year of Risks
Having said all of this, it doesn't imply that 2012 will not turn out to become a year of risks: (aamof) It Will!

New Risk Management
Main issue will be that we'll have to change our view on Risk Management in 2012 from a classical view to a new self-conscious view ...

The old classical view goes something like this:


In the old view, Regulation and Governance are more or less considered as 'constant' and as a 'condition you have to meet'.

However,  nothing is farther from the truth.
In the last decade we've seen that changes in Regulation substantially have influenced the way we calculated, perceived and managed risk. The obvious examples are everywhere around us: Solvency II, Basel I/II/III, AIFMD, MIFID, OTC, etc., etc.........

So, in fact the new simplified Risk Management looks (less spectacular) more like this:


In this 'New'  Risk Model, EVERYTHING -including Risk management itself, is considered as RISK!

Main issue is not to take anything (or risk) for granted and to (re)consider each risk element (minimal) once a year in order to keep RISK FIT.

Just a few illustrations on some of the new risk topics to set the mind in the right direction:

I. Regulation Risk

It's not just a case of checking if you're Regulation Risk Compliant. It's also anticipating on coming new legislation, directives and rules. Not only 'formal' new directives (like Solvency) but also informal rules like CSR's  "acting green" are important. Not acting pro-active could cause a severe reputation risk.


II. Governance Risk
It's not only about improving (corporate) governance quality and reducing the risk of governance failures, it's more. Managing the risk of governance risk, is double and independent checking on:
- Truly independence of (supervisory) board members
- Timely (3 years) rotation
- Appointing timely 'new' knowledge in boards, audit/investment committees
- Transparent reporting to shareholders and regulators about (different) views
   and explaining WHY decisions have been taken the way they are, including
   pro and contra arguments.

III. 'Risk Appetite' Risk
- Check (by reporting!) regularly if your risk budget and risk results
   (SD, Sharpe Ratio, Sortino Ratio, Information ratio, etc) are still in
   line with your risk appetite. If not: Act upon it!
- Compare your risk appetite and the results with those of compettitors.


IV. Models and Data Risk
Change and adapt your data and used models regularly with reality.
You do? ......
E.g.: Risk is not just Standard Deviation (SD). If so, why are Efficient frontiers in ALM still calculated and published on basis of simple (but not applicable anymore!) SD.


Anyhow.... Risky and Happy 2012 Risks!

Related Links:
- Definitions: SD, Sharpe Ratio, Sortino Ratio, Information ratio, etc
- PWC European financial regulation updates
- EIFR
- Bloomberg Financial regulation
- ICFR: What does good regulation look like?