May 14, 2015

Risk Management Ground Rule

Risk Management is a awkward and hard to grasp discipline. Not only in boardrooms, but also in the practice of our professional risk management discipline.

Once you think you've captured risk management, it captures you...... again and again...

By definition risk management is a paradox.

Once you fully 'control' and 'manage' a certain risk, it's no longer really a 'risk' in the sense that it can surprise you.

However..., did you check and do you manage the following risks?

Meta Risk Management Risks

  1. Risk Framework Risk
    All (regulatory) rules and principles you apply in risk management are filters that cause new risks. Therefore every kind of risk management framework is also a source of risk and should be part of your risk management framework.
    Have you identified weak spots in your risk management framework?
     
  2. Risk Measures Risk
    Every risk measure taken, causes a new risk.
    Have you identified what the risks of risk management measures are?
     
  3. Model Risk
    All models you use in risk management are dangerous and risky approximations.
    Therefore, always use at least a second 'Challenger Model' to fully understand, check, calibrate and control your risks and risk measures.
    Do you have at least one challenger risk model in place?
     
  4. Unknown Risk Preparedness
    In the heart of the matter 'managing risk' is not primarily  'risk management'. Preparing for unknown risks is what risk management is really about.
    Do you have a procedure in place for managing unknown risk events?

Congratulations if you have successfully passed the above Meta Risk Management Test.


Ground Rule
Yet, there's still one risk management  ground rule you could have violated.... Denying this ground rule is the same as the ground rule itself!

Never classify any event or reported risk as not relevant  


Examples

A. Example Challenger
One of the most classic examples of violating this ground rule is the disaster of the space-shuttle Challenger back in 1986. Engineer reports about the failing two rubber O-rings that caused the accident, where denied by management.


Just recently we can observe another possible example of violation.

B. Stress Test  
On 11 may 2015 the supervisory authority EIOPA launched its first 'stress test' for European pension funds (IORPs;Institutions for Occupational Retirement Provision).

Now take a look at the initial response of a spokesman of the Dutch pension fund association (Source: IPE; translated):

  1. Not happy
    The Dutch pension sector is not happy with a stress test for pension funds, as issued by the European regulator EIOPA.
     
  2. Unnecessary
    According to the Pension Federation the test is 'not necessary' for Dutch pension funds and the test could lead to "unnecessary European rules'. The test is just a burden for the funds. A waste of their time. Besides the Pension Federation fears that the results lead to all kinds of EU rules which do not require in the Netherlands. We must be careful that there will not draw the wrong conclusions.
     
  3. Dutch Pension funds cannot Topple
    From a Dutch perspective, the test unnecessary, because Dutch funds cannot topple by what is regulated here in The Netherlands. 

It's clear that this kind of reactions are counterproductive and violate the ground rule of risk management.

To put it in a different way: Perhaps Dutch pension funds cannot topple, but they sure can collapse!


Conclusion
As experts in risk management we're all confident that we can identify, understand and manage risks. Unfortunately, nothing less is true...
We all have our blank space.......

Apr 6, 2015

Indecisiveness: the Risk of Risk

Behavioral Economic Stress Testing at Symetrics, a FinTech50 company that keeps me on the flow of life, kept me from blogging last months. Nevertheless, here's a new blog to chew on.....

Low Interest Rates
In traditional investment models, low and even negative interest rates are seen as simple stochastic outcomes, that eventually converge to the mean of the historical data as time progresses.

The well-known answer to the question "how long will interest rates stay low?" is mostly: don't worry, interest rates will rise again!

In our long term investment models the output equals the input. If we 'believe' that the average interest rate is 5%, than on the long term that's where we we'll be at....
At least, in our model, certainly not in reality.
Unfortunately, there is no such thing as 'mean reversion'. The reason why interest rates got down, is due to monetary, regulatory and economic drivers, that will keep and push interest rates down, as long as there's no substantial debt relief in combination with real (not paper-financed!) economic growth.

In a world with extreme low and even negative interest rates, financial (long term saving) institutions have no future. Based on one year default probabilities, traditional regulatory frameworks eventually force those long term guarantee institutions (e.g. mortgage banks, life-insurers and pension funds) to derisk their balance sheets and raise the price of their products. However, consumers are prepared to make a risk-return assessment on different grounds and are no longer willing to pay the price for risk.

Example
Let's illustrate this risk-return dilemma with a simplified practical example in a (unlikely?) long low interest world.

We consider the following portfolio investment case:
  1. Bonds (US) with average return of 1% and a standard deviation of 4%
  2. Stocks (S&P 500) with an average 8% return and 16% standard deviation

Next, we take a look at the Efficient Frontiers of the asset-mix combinations of Bonds and Stocks:


To prevent endless discussions we simply compare two possible portfolio investment strategies:
  1. Portfolio A: 80% Bonds & 20% Stocks
  2. Portfolio B: 20% Bonds & 80% Stocks
Obviously Portfolio A (PF-A) with an annual expected return of 2.4% and a (non-correlated) risk of 4.6%  looks less risky than PF-B. On the other hand PF-B with an expected 6.6% return and a (non-correlated) risk of around 13% looks promising on the long run. What to do? What is more or less risky?

The Risk of Risk
What is more risky, also depends on the risk premium. One traditional way to judge the pay out on risk, is to compare the 'Sharpe ratios' of the two portfolios. Major problem is to determine the appropriate 'risk free interest rate level', as the risk free rate is risky (volatile) itself and declining on average the last years.

So in fact we have to judge:

The Risk of Risk

To get an impression of the risk of risk free interest rates, we calculate the Sharpe ratios of the efficient frontiers.

Here are the outcomes:


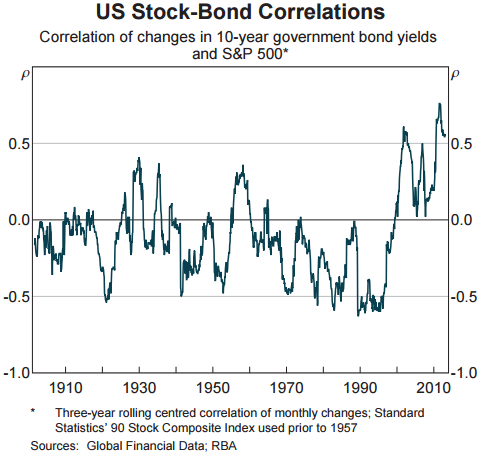
The above charts illustrate that at nearly every (0% - 3%) free risk interest rate, Sharpe ratios of PF-A are lower or somewhat equal to those of PF-B. Only in the case that Bonds are clearly negatively correlated with Stocks at a 0% or 1% risk free interest level, a PF-A strategy is less risky than PF-B.


As in 'normal' crisis situations most asset-classes (excluding Gold of course...) tend to be extremely positively correlated, PF-B is - also in this case - the preferred strategy. In other situations, the Bonds-Stocks correlation only changes incrementally, so your portfolio asset-mix can be adapted timely. There's no need for anticipation.


Another remark is that in case of an 0% risk free interest rate and an expected neutral to positive correlation between Bonds and Stocks, the Sharpe ratio values all converge between 0.4 and 0.5.
This implies that a clear criterion for taking an underpinned investment decision is absent. Investors become indecisive and that's just the situation we're in mid 2015, where all we seem to have are 


Investment Beliefs


Wrap up:


Return Analysis
On top of, it's interesting to analyse how PF-B makes its return as opposite to PF-B.
Without further comments, I'll give some illustrations. Make your own analysis with help of the Excel spreadsheet.

As expected the PF-B performs better in the [9%,∞] segment. PF-A gets its returns in the [0%,9%] segment and quite surprisingly PF-B performs better in the [-5.25,0%] segment.....


All this reasoning leads to a kind of 'informed decision' conclusion that in the current economic situation PF-B would be the best (preferred) strategy. However, there's another question to be answered....

Key question with regard to PF-B:

Can you absorb the extra yearly volatility? 


In 'normal'' regulatory frameworks, like Basel-III, Solvency-II and the upcoming 'Holistic Balance Sheet' for pension funds, the answer will mostly be:

NO 


One of the big issues in all of these frameworks is that risk and solvency margins are defined on basis of a one year default probability. This leaves no room to absorb one year standard asset deviations of around 12%. A commonly used solution is to 'hedge' these risks 'away'. However, hedging has its price and introduces new (collateral, clearing, systemic) risks. Hedging 'one deep' could perhaps be a solution, but as the market changes, soon you'll be 

Hedged to Hedging...

A better approach than hedging or the alternative of deleveraging balance sheets, would be to adapt and redesign our regulatory frameworks to the long term scope of financial institutions. This could be done by stretching the 'one year default criterion' to an 'n-year default criterion', where "n" is in line with a financial institution's ability to timely readjust company's liabilities and assets.

For a mortgage bank, a life insurer, "n" could in the order of 5 years. In case of a pension fund, "n" could vary between 5 and 10 years.

In this approach, the current different 'one year default probabilities'

Financial Institution Default Probability
Banks 99.90%
Insurers 99.50%
Pension Funds (Dutch) 97.50%

could be replaced by one uniform default probabilities of (say) 99.9% for n-years.

Here's the wrap up outcome for a 5 year average:


Notice that the expected average 5-year risk (standard deviation) has declined from 12.8% to 5.7% (= 12.8/ (√ 5)). This would roughly (rule of thumb) reduce capital requirements to a level of 19% (=5.7*3.27) of the balance sheet net-total, which is of course still substantial.


Conclusions
Low interest rates force financial institutions and regulators to rethink and redesign their business model.

Regulatory default rates have to be uniformed and the regulatory (EIOPA) system of 'one year default rates' has to be extended to a 'n-year default approach', where "n" is in line with a financial institution's ability to timely readjust company's liabilities, assets and capital.

After all these technical adjustments, also our investment models and methods have to be redesigned. Models, like demonstrated in this blog, that only rely on past observations are too limited for sound investment analysis.

Traditional investment models cannot cope with current market conditions and lead to indecisiveness or the next best alternative : 'Investment Beliefs'.

We have to develop models where we can risk risk...

How can we build more expressive models? Well, that's something for my next blog.....

Until then.... Keep believing...


Links
- Excel Spreadsheet Risk Analysis Portfolios

Dec 30, 2014

Human Development Index 1980 - 2013

Now that the year 2014 is coming to an end, let's take a look at the Human Development Index (HDI) over the years 1980 - 2014.

DEFINITION OF 'HUMAN DEVELOPMENT INDEX
The HDI is a tool developed by the United Nations to measure and rank countries' levels of social and economic development.

The HDI is based on four criteria:

  1. Life expectancy at birth 
  2. Mean years of schooling 
  3. Expected years of schooling 
  4. Gross national income per capita. 


The HDI makes it possible to track changes in development levels over time and to compare development levels in different countries.

How does your country rank on HDI?

Wish you all a nice Sylvester evening tomorrow!

Dec 21, 2014

Actuarial Readability

As an actuary, accountant or financial consultant, deep knowledge, expert skills and experience are key to writing an interesting article or paper advice.

However, no matter how much you're an expert, finally you're as good as you can get your message across to your audience.

The art of the expert is to simplify the complexity of his/her research into simple, and for the audience understandable text.

In practice this implies that the expert will have to measure the readability of his papers before publishing.

The two most important issues to tackle are 'readability' and 'text-level'.

Although there are many sorts of tests, both topics are simply covered by the so called  Flesch-Kincaid Readability Test.

Let's take a look ate the two simple test formulas of this test:


Flesch-Kincaid Readability Test


Flesch Reading Ease Score

FRES = 206.835 – (1.015 x ASL) – (84.6 x ASW)


Flesch-Kincaid Grade Level

FKGL = (0.39 x ASL) + (11.8 x ASW) – 15.59


With:
ASL  = average sentence length
number of words divided by the number of sentences

ASW = average number of syllables per word

number of syllables divided by number of words


Texts with a FRES-score of 90-100 are easily understandable by an average 5th grader and scores between 0 and 30 are best understood by college graduates.

Some examples of readability index scores of magazines:
- Reader's Digest Magazine: FRES = 65
- Time magazine: FRES = 52
- Harvard Law Review: FRES = 30

The FRES-test has become a U.S. governmental standard. Many government agencies require documents or forms to meet specific readability levels. Most states require insurance forms to score 40-50 on the test.


Where to test your documents?

Besides matching the FRES and FKTL scores in your document, as a guideline try to establish the next English text-test-characteristics
  • Average sentence length 15-20 words, 25-33 syllables and 75-100 characters.
  • Characters per word: < 7
  • Syllables per word: 1.5 - 2.0
  • Words per sentence: 15 - 20

This blog text resulted in scores:
- Flesch-Kincaid Reading Ease 64.7
- Flesch-Kincaid Grade Level 7.2
- Characters per Word 4.4
- Syllables per Word 1.5
- Words per Sentence 11.8


Example
As an example we test the readability of one of the articles of the Investment Fallacies e-book, as published by the Society of Actuaries (SOA) :

By Max J. Rudolph, published in 2014

The readability outcome is as follows:


Readability Score 'The Best Model Doesn’t Win'

Reading Ease
A higher score indicates easier readability; scores usually range between 0 and 100.

Readability Formula
Score
48.1

Grade Levels

A grade level (based on the USA education system) is equivalent to the number of years of education a person has had. Scores over 22 should generally be taken to mean graduate level text.

Readability Formula
Grade
10.3
12.9
14.2
9.5
__________________________
10.2
____
Average Grade Level
11.4

Text Statistics
Character Count 7,611
Syllable Count 2,531
Word Count 1,495
Sentence Count 98
Characters per Word 5.1
Syllables per Word 1.7
Words per Sentence 15.3


Actuarial Texts
With regard to public financial or actuarial publications a FRES-score of around 50 assures, that your publication reaches a wide audience. Even in case you're publishing an article at university level, try to keep the FRES-score as high as possible.

If you write an academic paper, you may use the online application Word and Phrase to measure the percentage of academic words. Try to keep this percentage below 20% to keep your document readable. The publication 'The Best Model Doesn’t Win' would score 17% on academic words......


Finally
Next time you write a document or make a PPT presentation, don't forget to


Links:
WORD AND PHRASE

Nov 9, 2014

Retirement Age Development

Due to the continuous ageing process and a strong ongoing growth of life expectancy, countries need to increase their formal retirement age.

Actuarial calculations show  in general that - in order to keep pensions affordable - the formal pension age for future generations will eventually have to increase to the age of 71 or even 75 years.

However, lifting up the retirement age is not an easy process, as people have grown up with the concept of a steady retirement date, all their life. As if 'work is slavery' and life only really starts at your pension date, when you abruptly stop working and live a life behind the window of your apartment...

However THE pension date doesn't exist, it's an illusion, a fata morgana...


Not only that retirement increases the age-related decline of health and cognitive abilities for most workers, it also increases your mortality rate, as a RP-2000 Mortality Study shows:


Secondly, nobody - not even an actuary - can predict the outcome of a pension plan over a period of 60-70 years. Pension dates and and long term pension outcomes are by definition unsure.

OECD Retirement Ages
What we can do is keeping the retirement age in pace with the development of our life expectation. This is exactly what some OECD countries have done, as the next chart shows:


Of  course, the optimal retirement planning depends on several economic en demographic developments in a country.


On the OECD page you can play and compare several pension-related variables across different countries.

Enjoy playing and learning from these OECD data.

Links
- Unhealthy Retirement (2014)
- Does working longer increase your lifespan? (2010)
- OECD Page

Oct 6, 2014

Future Role of THE Actuary

To quote a leading Dutch actuary (Jeroen Tuijp):


THE Actuary doesn't Exist!


But what is, or could be the role of an actuary in the next decade?

Perception: What's an actuary?
The answer to the question "What's an Actuary?", strongly depends on who you are asking.

Some examples of possible answers:

  • Accountant: An Actuary helps to estimate and understand discounting the assets and liabilities
  • Board Member: My Actuary is my premium and liability adequacy advisor, he manages risk
  • Risk Manager: Our Actuary helps me to identify hidden risks and estimate embedded options
  • Investment Manager: Our Actuary helps me to define ALM and investment models
  • Administration Officer: I ask our Actuary for advice on how to administrate in an efficient way
  • ICT Manager: The actuary is responsible for defining the equations in our system
  • Marketing Manager: Our actuary is the driving force behind product development
  • Supervisory Board Member: Our Actuary is the lock on the door

The perception of the professional  contribution of an actuary not only depends on the view in the eye of the beholder, but also on the wide variety of roles that actuaries fill in all kind of organisations.

Some examples of the endless list of the many different (actuarial) roles and positions that actuaries fill in:
  1. Certifying Actuary, Advisory Actuary, Valuation Actuary
  2. Pension Actuary, Investment Actuary, General Insurance Actuary, Health Actuary, Life Actuary, Claims Actuary, Public Pension Actuary, Reinsurance Actuary
  3. Risk Manager, Capital & Solvency (II) Manager, 
  4. Marketing Manager, Head Product Development, Head Financial Control
  5. CEO, COO, CFO, CIO, CRO, CXX 

On top of, the actuarial work field comprises a list of detailed professional disciplines, such as:
  • Regulation: Solvency (II) , Basel,
  • Technical Life Topics: Mortality, Longevity, Healthy Life years, 
  • Technical Non-Life Topics: Car & House Insurance, Catastrophe Risk, Health Insurance, 
  • Investment Topics: ALM, Risk Return Policies, Tail Risks, Economic Risks
  • Long list: Compliance, Resilience, Tax, Ethics, Financial Reporting,  Reinsurance, etc...

All of these viewpoints and wide professional manifestations make it hard to classify and compartmentalize actuaries, especially in and around boardrooms. Yet, actuaries are nearly in every field present, often without being identified or recognized as such!

An actuary is what we call 'The Elephant in the Room', or perhaps better formulated:

THE Actuary is the Multi-Perceived Elephant in the Boardroom


Stereotypes
Despite of the wide range of positions actuaries can fulfill, it becomes harder and harder for actuaries to follow a career path that leads to a boardroom position as CXX...


Why is it so hard for an actuary to end up as CEO or COO of a company?

The simple answer to this question is:


Thinking in Stereotypes


Because actuaries are good at mathematics, people in general as well as professionals continue to view and stigmatize them as Overspecialized Nerds and Brilliant Autistics. This way of (wrong) stereotype thinking identifies actuaries often as 'problematic communicators' and 'non-managers'. As a consequence, the managerial qualifications of a lot of actuaries are unfortunately overshadowed by their outstanding professional technical skills.

Thinking in stereotypes is a phenomenon that is around us everywhere, as is shown in Herge's comic book "The Valley of the Cobras". In this book the (quixotic) 'Maharajah of Gopel' is vacationing in the french ski-resort of Vargése. Suddenly the Maharajah discovers his pearl necklace has been stolen and he needs a detective to track down his necklace.The rest of the story is shown in the short comic strip below (click to enlarge):

 
'
Conclusions and lessons Learned
THE future role of THE Actuary doesn't exist. As an actuary, fill in every professional role that attracts and fits you. Try it out, to discover you can fill in more than one role in the many healthy life years  ahead of you......

Finally some wrap up ground rules to keep in mind:

  1. Never think in stereotypes as an actuary!
  2. If you are an actuary and have the ambition to become a CEO, CFO or CRO of a company: Act, Dress, Speak and Behave accordingly, as other people probably will keep thinking in stereotypes
  3. If you meet other actuaries: Talk and behave like an actuary
  4. Ground Rule Number One: Always Stay Yourself!


Links

Jul 6, 2014

Understanding Confidence Levels in Time

What's the right understanding of the concept of 'confidence level' for a financial institution?

That's not an easy question....

A short (popular) definition of confidence level in terms of Solvency and Basel regulation would be:

The probability that a financial institution doesn't default within a year.


In this blog I'll discuss and compare three more or less accepted confidence levels (CFLs):

  1. Dutch Pension Funds: CFL= 97.5% 
  2. Life Insurers (Solvency II): CFL = 99,5%
  3. Banks (Basel II/III): CFL = 99.9%

Understanding Confidence Level
Before we get into the details, let's first shine a light on a widespread misunderstanding regarding the concept of 'confidence level'.

To make the concept of confidence level more understandable, one might argue as follows:

  1. The confidence level of a Dutch pension fund is defined as 97.5%
  2. This implies that there's a one years probability that the pension fund has an one year default probability of 2.5% (= 100% - 97.5%)
  3. This implies that the pension fund on average defaults once every 40 years (= 1 / 0.025)

This method of reasoning is completely


WRONG


The mistake that's been made is more or less the same as the next two fallacies:
  1. If one ship crosses the ocean in 12 days. 12 ships will cross the ocean in one day
  2. I fit in my jacket, my jacket fits in my suitcase, therefore I fit in y suitcase


Explanation
The probability of a pension fund with a confidence level of 97,5% going default, can be approximated by a simple Poisson distribution as follows:

From this we can conclude:

  • In 40 years the pension fund has a 63% default probability.
  • The probability that the pension fund defaults more than once is 26%
  • The probability that the pension fund defaults exactly once in a 10 years period is 19.47% 

Insurer Confidence Level
For an insurance company with a confidence level of 99.5% the results are:


So even an insurer has a 4.88% default probability in a 10 years period on basis of a 99.5% confidence level. Keep this in mind if you take out a life insurance policy!!!


Banking Confidence Level
It starts getting serious when it comes down to a 99,9% confidence level for banks:


Comparison
Comparing the default probability of (Dutch) pension funds, insurers and bank on the long run:


Finally
Although this blog gives some more insight about the consequences of confidence levels on the long run, the real question of course is: what's the price you have to pay to avoid default risks?
That's something for another blog.....


Sources/Links
- Spreadsheet with tables used in this blog

May 18, 2014

Bonds: a Crisis Risk Indicator?

As a risk professional you've learned to classify an increase in bond's interest volatility (or standard deviation) as an indicator that bonds have become more risky. Right you are....

Now, with this knowledge, let's take a look at the next chart, presenting the long-term (10Y) interest rate of some of the leading EU member states from January 1993 to April 2014:

This chart clearly shows that :
  • Since the introduction of the Euro in 1999, country spreads start declining
  • Interest rates converge to the year of the famous (Lehman) crisis in 2008
  • After the 2008 crisis, rating agencies wake up and spreads explode again

Let's take a look in more detail, by some log scale zooming......

To find out if the convergence of interest rates really is a kind of early warning crisis indicator, let's add some more EU countries to the chart.


Now the picture becomes clear: A structural decline in bond's standard deviation is not a decline in risk, but more the opposite....

As standard deviation decreases, (crisis) risk increases!

We can check this by looking at the cross-country standard deviation development in time:

These charts, presented on a vertical linear and log scale basis, clearly  illustrate that as soon as the standard deviation hits the 0.2% level, crisis can be expected soon.

Not only is the 0.2% SD-level an early warning indicator for the 2008 crisis that started with the bankruptcy of the Lehman Brothers bank, but it's also an indicator of 'Dot Com' crisis in 2000....

Finally
Meanwhile... as from February 2012, standard deviations are declining  again. Time to worry?

Key questions are:
  • when will standard deviation hit the 0.2% floor again? 
  • and when it does, will there be another crisis?

Remember lesson number 1 in risk management: Crises are unpredictable!
Nevertheless, once 0.2% SD  turns up: fasten your investment seat bells....


Links/Sources:
- Spreadsheet of charts used in this blog
- EU Interest Rates
- Big Picture Chart

May 4, 2014

Discussing Life-Cycle Pensions & Longevity

In this blog I'm going to discuss two persistent pension topics:

  1. One of the most common misunderstandings in pension fund land is that an individual (member) investment policy weighs up to a collective investment approach.
  2. Is there a rule of thumb that expresses 'longevity risk' in terms of the yearly return?  

1. Collective vs. Individual Investing Approach
In case of a 'healthy pension fund', new members will join as time continues. In a mature pension fund the balance of contributions, investment returns, paid pensions and costs will stabilize over time.

Therefore the duration of the obligations of a pension fund will more or less stabilize as well. The duration of an average pension fund varies often between 15 and 25 years. Long enough to define a long term investment strategy based on a mix of risky equities (e.g. 60%) and fixed income (e.g. 40%). Regardless of age or status, all members of a pension fund profit from this balanced investment approach.


In case of an individual (member) investment strategy, the risk profile of the individual investments has to be reduced as the retirement date comes near. In practice this implies that 'equities' are reduced in favor of 'fixed income' after a certain age. As the age of a pension member progresses, the duration of the individual liabilities also decreases, with an expected downfall in return as a consequence.

Let's compare three different types of investment strategies to get a clear picture of what is happening:

  1. Collective Pension Fund Strategy Approach: Constant Yearly Return
    40% Fixed Income à 4% return + 60% Equities à 6% = 5.2% return yearly
     
  2. Life Cycle I Approach ('100-Age' Method)
    Yearly Return (age X): X% Fixed Income à 4% + (100-X)% Equities à 6%
     
  3. Life Cycle II Approach (Decreasing equities between age 45 and age 65)
    Yearly Return (age X) = MIN(MAX((6%+(44-X)*0.1%);4%);6%)

All visually expressed in the next chart:


Pension Outcomes
Now lets compare the pension outcomes of these three different investment strategies with help of the Pension Excel Calculator on basis of the next assumptions:
- Retirement age: 65 year
- Start ages 20 and 40
- 3% and 0% indexed  contributions and benefits
- Life Table NL Men 2012 (NL=Netherlands)

Results Pension Calculations (yearly paid pension):


Conclusion  I
From the above table we can conclude that switching from a collective investment approach to an individual investment approach will decrease pension benefits with roughly 10%. Think twice before you do so!


2. Longevity Risk Impact
To get an idea of the longevity impact on the pension outcomes, yearly paid pensions are calculated for different forecasted Dutch life tables (Men).

Life Tables


Forecast Life Table 2062 is calculated on basis of a publication of the Royal Dutch Actuarial Association.

The Forecast Life Table 2112 is (non-official; non scientific) calculated on basis of the assumption that for every age the decrease in mortality rate over the period 2062-2112 is the same as over the period 2012-2062.

Pension Outcomes per Life Table
Here are the yearly pension outcomes on basis of the forecasted life tables:


From the above table, we may conclude that the order of magnitude effect of longevity over a fifty to seventy year period is that pensions will have to be cut  roughly by 25%-30%.


Another way of looking at this longevity risk, is to try to fund the future increase in life expectation from the annual returns.

The next table shows the required return to fund the longevity impact for different forecasted life tables:


Roughly speaking, the expected long-term longevity effects take about 0.7%-1.2% of the yearly return on the long run.


Finally
Instead of developing a high tech approach, this blog intended to give you some practical insights in the order of magnitude effects of life-cycle investments and longevity impact on pension plans in general.

Hope you liked it!


Links/Downloads: