
On March 28 2013 the S&P 500 hit a new record
1,569.19  6.34(0.41%) Mar 28
Key question is of course will 'L'histoire se répète".....???
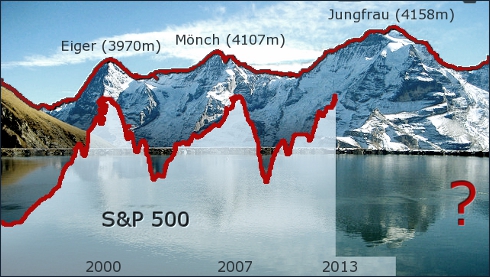
Now, take a short look at the (above) S&P 500 last decades development.

Let nature do its work by drowning your brain in the unstoppable growth of debt and considering the fiscal cliffs and endless Quantitative Easing (QE) programs.
Ask yourself... will new QE-X programs really offer any help....
Without any doubt or any complex investment analyses it's clear that we're heading for a Jungfrau's downfall.
The question is not if, but when exactly and how deep?
S&P 500

Every year Aswath Damodaran, professor of Finance at the Stern School of Business at NYU, updates the S&P 500 yearly total return and compares it with the yearly performance of 10Y U.S. Treasury Bonds and Treasury Bills.
Last year's (2012) performance comes down to:
- S&P 500 : 15.83% ('stocks')
- T. Bills : 0.05%
- 10Y T. Bonds : 2.97%
Let's take a look at a more general summary of his conclusions:

Most financial institutions (pension funds, insurers, investment funds, banks) are at the crossroad of taking difficult decisions. Investing in 10Y Bonds with an artificial and historical low interest rate of around 2-3% with the risk of depreciation in case of raising interest rates, due to inflation or otherwise. Or going for 'risk' by investing in S&P 500 like funds with relatively high risk.......
In order to get more sight at this 'risk' issue, let's take a look at the 10 and 5 years development:

From this quick investigation it becomes painfully clear that - despite whatever the risk free rate may be - all risk indicators (sharpe, Sortino) point out that the risk on s&P 500 stocks is not adequately rewarded. The M2 (Modigliani risk-adjusted performance) indicator expresses that same fact more intuitively by showing a 10y S&P 500 fictive return of 4.2% if we correct the 10Y average performance of 7.9% for the additional risk level of S&P 500 stocks (against the risk level of 10Y bonds).
Sharpe, wider and in detail
As becomes clear from the next historical sharpe chart, the last decade is not really convincing that an S&P
500 strategy will pay out......

Take a long Breath...
To confidentially execute a S&P 500 investment strategy it takes a period of 17 years (or more) to avoid an average negative return, as the next charts shows.

In practice this implies that mainly pension funds - with long investment horizons of 15 years and longer - can benefit more or less long-term riskless from a S&P 500 investment strategy.
However, even from a 17-year cycle perspective it's clear we're still in a long-term downward trend.
Don't worry, if 'math' shows we're out of options, we can always pray!
Links
- Damodaran Blog: A Sweet Spot for US Equities: Opportunity and Dangers- Yahoo S&P 500
- Spreadsheet: historical returns S&P 500 - Bonds
- Spreadsheet: S&P-500 Analysis


 LinkedIn Actuary-Info Group
No comments:
Post a Comment