Apr 5, 2013

S&P-500 or Bonds?

On March 28 2013 the S&P 500 hit a new record
1,569.19 Up 6.34(0.41%) Mar 28

Key question is of course will 'L'histoire se répète".....???


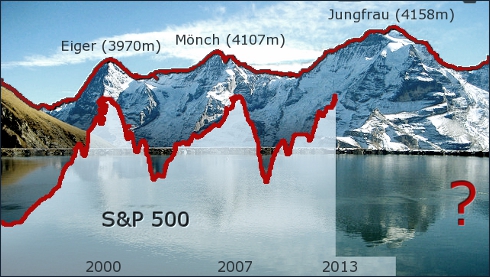
Now, take a short look at the (above) S&P 500 last decades development.

Let nature do its work by drowning your brain in the unstoppable growth of debt and considering the fiscal cliffs and endless Quantitative Easing  (QE) programs.

Ask yourself... will new QE-X programs really offer any help....

Without any doubt or any complex investment analyses it's clear that we're heading for a Jungfrau's downfall.

The question is not if, but when exactly and how deep?


S&P 500 
Every year Aswath Damodaran, professor  of Finance at the Stern School of Business at NYU, updates the S&P 500 yearly total return and compares it with the yearly performance of 10Y U.S. Treasury Bonds and Treasury Bills.

Last year's (2012) performance comes down to:

- S&P 500 : 15.83%  ('stocks')
- T. Bills               : 0.05%
- 10Y T. Bonds : 2.97%

Let's take a look at a more general summary of his conclusions: 


Difficult Choice
Most financial institutions (pension funds, insurers, investment funds, banks) are at the crossroad of taking difficult decisions. Investing in 10Y Bonds with an artificial and historical low interest rate of around 2-3% with the risk of depreciation in case of raising interest rates, due to inflation or otherwise. Or going for 'risk' by investing in S&P 500 like funds with relatively high risk.......

In order to get more sight at this 'risk' issue, let's take a look at the 10 and 5 years development:


From this quick investigation it becomes painfully clear that - despite whatever the risk free rate may be - all risk indicators (sharpe, Sortino) point out that the risk on s&P 500 stocks is not adequately rewarded. The M2 (Modigliani risk-adjusted performance) indicator expresses that same fact more intuitively by showing a  10y S&P 500 fictive return of 4.2% if we correct the 10Y average performance of 7.9% for the additional risk level of S&P 500 stocks (against the risk level of 10Y bonds).

Sharpe, wider and in detail
As becomes clear from the next historical sharpe chart, the last decade is not really convincing that an S&P

 500 strategy will pay out......


Take a long Breath...
To confidentially execute a S&P 500 investment strategy it takes a period of 17 years (or more) to avoid an average negative return, as the next charts shows.


In practice this implies that mainly pension funds - with long investment horizons of 15 years and longer - can benefit more or less long-term riskless  from a S&P 500 investment strategy.

However, even from a 17-year cycle perspective it's clear we're still in a  long-term downward trend.

Don't worry, if 'math' shows we're out of options, we can always pray!

Links
-  Damodaran Blog: A Sweet Spot for US Equities: Opportunity and Dangers
- Yahoo S&P 500
- Spreadsheet: historical returns S&P 500 - Bonds
- Spreadsheet: S&P-500 Analysis

Mar 25, 2013

Compliance Plus Check

Most often and at a basic level, compliance is perceived and defined as 'regulatory compliance'.

If we comply (act in accordance) with federal or local or local authorities and their requirements, making sure that our company is following all the necessary rules and regulations, we seem done.

Compliance Plus...

However, the regulatory compliance level is only a start. 

It's simply not enough to be 'Supervisory Compliant'. Compliance is more! Much more.....

Let's find out what Compliance Plus represents...


Compliance, a Competitive Tool
In practice, compliance can be a distinctive competitive tool​. Being ahead of regulatory compliance, means that a company defines its own compliance level that not only includes regulatory compliance, but also its own professional compliance level, based on its own specific risk structure. 


Compliance, Part of Risk Management
Moreover, one compliance level higher, compliance also embeds the risk of future change of regulations rules and the not-yet-defined compliance rules of future products and investment strategies that are necessary for a sustainable successful development of your company.

As  regulation changes when the economic of financial circumstances change, regulatory compliance is also a substantial part of risk management. That's why regulatory compliance has to be included in our risk models. 

Compliance Check
To check if your company is compliant at a Compliance Plus Level, simply 


at Symetrics. It takes only two minutes to take this test, as all compliance check boxes are already 'checked' in advance. So if you like 'unticking boxes' instead of 'ticking boxes', here's a splendid opportunity.

Mar 17, 2013

AIFMD Fun of Funds

To prevent future crises, a new European law, the Alternative Investment Fund Managers Directive (AIFMD)  came into force on 22 July 2011.

The new directive has to be implemented before 22 July 2013 and will also apply to non-EU fund managers if they ares managing or marketing an AIF to investors in the EU.

It is believed that the directive will reduce the number of non-EU managers operating within the EU.

AIF's assets and risk management
Although the AIFM-Directive has many new demands (appoint independent valuer, custodian, disclosure) we'll focus here on the requirement to ensure an independent evaluation of the AIF's assets and risk management.

AIFMD Risk Management Obligations
  • Every AIFM needs to have an adequate documented risk management policy, covering all possible risks faced by the AIFs
  • Every AIFM has to set quantitative and qualitative risk limits for each AIF for all possible kind of risks 
  • An AIFM's Risk Measurement Procedure should include requirements for: backtesting, stress-testing, scenario analyses and the rules should describe remedial action plans when limits are breached. 

So far so good, peace of a cake, you would think. Unfortunately: NO!

1. In-depth market risk assessment: too complex and not adequate
An adequate in-depth market risk assessment of AIFMs AIFs actually requires a full 'fund of funds' transparency of the portfolio of the (AIF) funds.

The problem is that full 'fund of funds' transparency does not exist yet, nor can it finally be fully obtained. It's simply too complex:
  • undefined systemic risks are often beneath the analyse surface
  • (re)hedged risks could be part of a fatal unknown or unapparent self-reference hedge cycle
  • in-depth 'fund of funds' management is time consuming and presumes that risk profiles of sub-funds are available, when in practice they are often not

To illustrate the desperate, funny and useless efforts that are made to tame the 'fund of funds' issues within the AIFMD, just take a look at the next quote from the AIF Handbook draft 2013 :

Section 5-iii-1, Alias 'Fun' of Funds
"Any proposed investment by a Qualifying Investor AIF into another investment fund must be clearly disclosed.
Disclosure must focus on the implications of this policy regarding 
increased costs to unitholders (i.e. the fact that fees will arise at two or, in the cases where the underlying fund it itself a fund of funds, three levels – the Qualifying Investor AIF, the underlying fund of funds and the underlying funds in which the underlying fund of funds invests) and the resultant lack of transparency in investments."

I hope you're still with me after all this fund of funds of funds of funds fun..... ;-)

Thus, in-depth market risk assessments in a non transparent market are inadequate and may potentially result in ill-founded or even erroneous conclusions (e.g.' false safety').

Market Risk Assessment
The adequacy of an AIFMD's Market Risk Assessment could be roughly defined as:

MRA-Adequacy = ADTQ x RPQ x RMQ


With: ADTQ= Asset Data Transparency Quality, RPQ= Risk Policy Quality and RMQ = Risk Model Quality.

Just let your colleague rate your ADTQ, RPQ and RMQ on a ten point scale. If the outcome MRA-Adequacy is lower than 800, consider your test as inadequate.

As transparency also includes full sub-cycle  'fund of funds' transparency, often ADTQ will not score high enough for an adequate test outcome.

Example
Suppose an AIF consists of 30% 'fund of funds' with minor risk information regarding the sub-funds.All other scores of the AIF score well (10). In this case the test adequacy score is 700 (= 7 x 10 x 10) . Conclusion: the quality of your risk assessment is insufficient for drawing robust conclusions.

2. Alternative: Strategic Market Risk Assessment
Instead of - come what may - trying to get to the endless bottom of a 'fund to fund' construction, a more strategic risk assessment approach -  as an alternative -could work out much more effective. A strategic market risk assessment that assesses the nature, risk and policy of a AIF and its investments and that implicitly takes into account non-linear risks, the presence of systemic risk, a large number of weighted and not-weighted economic scenarios, stress tests and fat tail risks.

The Secret of the Chef
Many (hedge) funds have only a limited transparent investment policy or an investment policy that  - for whatever reason -is regarded as 'The Secret of the Chef'.

In these kind of funds 'full disclosure' will end in a lot of degrees of freedom in 'risk policy' and corresponding mandates.

It's important to realize that the more degrees of  freedom in 'risk policy' a manager of a fund has, the more risk will emerge in the above formulated alternative assessment.

New alternative market risk models?
Key question is: are there new models that can assess investment strategies and portfolios in a systemic risk environment and on basis of non-linear modeling.

The answer to this question is : Yes, very soon!

Symetrics, a brand new company in the Netherlands is developing an investment decision support and assessment system called SyMath, that is based on nonlinear modeling, grasps systemic risk and includes future crises. SyMath will be on the market mid 2013.


Until then will have to assess AIFMs with pen and pencil... ;-)


Links, Used Sources