Never heard of of Soft-Risk Management? After this blog you'll never forget!
Google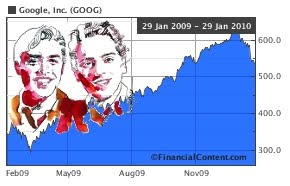
This month
Google's world class co-founders Page and Brin announced (
SEC filing) they'll sell 17% of their shares (at today’s prices valued at $5.5 billion) in the next five years.
As a consequence their voting rights will be reduced to 48%, implicating they will no longer have a majority control.
“They are both as committed as ever to Google...”, Google said in an
e-mailed statement.
Why this statement? Was there anyone who doubted this?
Of course Google is still and will hopefully stay a strong company and a strong brand. Nevertheless - without jumping the conclusions - it's clear that this low-key announcement, although it doesn't seem to have any direct financial consequences, might turn out to be the straw that breaks the camel's back in Google's life cycle development. This kind of company press release is in fact a 'disguised risk indicator', or in other words a :
Soft-Risk Indicator (SRI)
A SRI may be defined as 'knowable' information about a company, that could influence the company's value now or in the future , but doesn't seem to have enough (financial) power to do so now or on its own
Although just one ignored SRI could already be fatal, a combination of two or more SRIs could become a severe risk. A bunch of SRIs could create a chain reaction and lead to a kind of supernova explosion.
It's just like a grain
dust explosion. A few grains are no risk, they don't explode. However in an accumulation of grains, one innocent 'hot' grain or a small environmental change in dust concentration, is enough to
create a mega explosion. Just like grain dust, SRIs can become a severe risk when the environment (suddenly) changes.
Consequently, an out of the blue 'change of environment' is also a Soft-Ris Indicator on its own.
Don't mix up Soft-Risk with Systemic Risk. Dust particles don't directly 'participate' in one another, in fact they build up to a certain critical density.
Soft Risk Loss
SRL = E( SRIi=1,2..n )It's just the composition of SRIs in combination with the special SRI of 'the change in environment' that creates a major accumulated (explosion) Soft-Risk that may eventually result in a Soft Risk Loss (SRL). However, once the SRL has occurred and has been measured, the corresponding SRI becomes a 'normal' Risk parameter.
Are there more Google SRIs?
Yes! One of the best Soft-Risk Indicator blogs of 2009 is written by Googles leaving lead visual designer
Doug Bowman, it's called:
Please read the next
extract of Bowman's blog from a risk management perspective, as he explains his decision to leave Google after three years.
- 20 Mar 2009 -
Goodbye, GoogleWithout a person at (or near) the helm who thoroughly understands the principles and elements of Design, a company eventually runs out of reasons for design decisions. With every new design decision, critics cry foul. Without conviction, doubt creeps in. Instincts fail. “Is this the right move?” When a company is filled with engineers, it turns to engineering to solve problems. Reduce each decision to a simple logic problem. Remove all subjectivity and just look at the data. Data in your favor? Ok, launch it. Data shows negative effects? Back to the drawing board. And that data eventually becomes a crutch for every decision, paralyzing the company and preventing it from making any daring design decisions.
Yes, it’s true that a team at Google couldn’t decide between two blues, so they’re testing 41 shades between each blue to see which one performs better. I had a recent debate over whether a border should be 3, 4 or 5 pixels wide, and was asked to prove my case. I can’t operate in an environment like that. I’ve grown tired of debating such minuscule design decisions. There are more exciting design problems in this world to tackle.
I can’t fault Google for this reliance on data. And I can’t exactly point to financial failure or a shrinking number of users to prove it has done anything wrong. Billions of shareholder dollars are at stake. The company has millions of users around the world to please. That’s no easy task. Google has momentum, and its leadership found a path that works very well. When I joined, I thought there was potential to help the company change course in its design direction. But I learned that Google had set its course long before I arrived. Google was a massive aircraft carrier, and I was just a small dinghy trying to push it a few degrees North.
I’m thankful for the opportunity I had to work at Google. I learned more than I thought I would. I’ll miss the free food. I’ll miss the occasional massage. I’ll miss the authors, politicians, and celebrities that come to speak or perform. I’ll miss early chances to play with cool toys before they’re released to the public. Most of all, I’ll miss working with the incredibly smart and talented people I got to know there. But I won’t miss a design philosophy that lives or dies strictly by the sword of data.
The resemblance between Google and the financial sector is striking.
Can you see it?
Simply replace the next words in the above 'Google, Goodbye' article:
Google => X-Bank, Engineer => Accountant, blue => risk strategy
Design => Risk, border => uncertainty, pixels wide => promille
To help you, just press the next 'replace button' to change the text in the article and read the text again. This looks astonishing familiar, doesn't it?
Replace
More Soft-Risk IndicatorsBowman's blog makes clear that there's another Soft-Risk Indicator, called:
Data Decision Tunnel Vision- Every decision in only based on data and models.
- Intuition and Fingerspitzengefühl are banned.
- Craftsmanship is not respected, but must be proved in detail with evidence based on facts and data.
- Possible events that can't be translated into (financial) data are not recognized as risk and are ignored.
- Events that don't fit into the data model are reformed until they do fit in
- Micro management confines the development of a helicopter view on the main risks
Although the list of Soft-Risk Indicators is endless, I'll try to list some common examples (mail me if you have more SRIs examples).
Examples of SRIs- Frequent or unexpected change of CEO or other board members
- Unexplainable or untimely Actuary or Accountant change
- Intentions of board members not in line with policy
- Too good to be true revenues, profits, reporting or communication
- Delay in reporting or publishing
- Lack of transparency
- Conflicting statements or publications
- Main (unexplainable) shareholder changes
- Over-explaining by board members
- Unexpected main reallocation of assets
- Vacancy or Recruitment stop; Reorganizations
- A company takes extremely more risk after a HQ-Risk Analysis
- Increasing customer dissatisfaction
Soft-Risk or Risk?Most of the SRIs are not present or recognized as Risk in our models. Why? Simply because SRI losses are not in the data we analyze. This could be (1) because of the very low occurrence probability of a SRI loss (the loss simply didn't occur yet), or (2) because most of the SRIs aren't identified as SRI or Risk at all, as they simply do not exist yet. Just like a sleeping virus, they might come into Risk Existence on basis of (unknown) future (environmental) changes.
The key difference between 'Risk as we now it' and a SRI is that a SRI is by definition 'not measurable'. SRIs manifest themselves directly in practice as a (non-directly traceable) loss occurrence.
VaR Models failThis also implicates that our traditional VaR models are definitely wrong, because they only include '
risks of the past' en no '
future risks', e.g. Soft-Risks. These VaR-models significantly underestimate the risk in the tail.
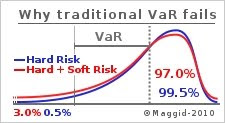
Problem is that as VaR-probabilities are getting smaller and smaller (0.5% or less) it also gets increasingly more difficult to prove the models are right. Consequently the VaR-model loses his power.
Backtesting and recent studies show that we ought to be able to identify most bad VaR models, but the worrying issue is that we can't find any good models, moreover because SRIs are not
in the model.
Denying Soft-Risk Indicators: The MeltdownYou might think '
Who cares about SRIs if you can't measure them?". Well, let's see what happens if we deny Soft Risk Indicators.
The most likely dead-end meltdown scenario of denying Soft-Risk Indicators goes something like this:
- The first years of a company's life is a race for revenues. Risk Management is on the second plan, as there's little to lose.
- After a few years revenues and profits grow, but become vulnerable and volatile. A new Board is appointed and a Risk Management Plan (RMP) comes in place to stabilize and improve results and to guarantee continuity.
- After the RMP has shown fantastic results for some years, some strange unexpected serials of events (SRIs) happen. The Board consciously discusses the effects of these events and concludes their company's results are not infected by the events. Moreover, company results are better than ever and the company's RMP has proven to be (Titanic) watertight.
- To be sure and transparent the Board checks its conclusions by ordering an external risk audit. The external auditor is just as biased as the Board and confirms the Board's conclusions: RMP is O.K.!
- Suddenly there's a totally unexpected big accident, a substantial one of loss. At first things still look under control, but soon the situation takes over. The board is no more in control. The company is lost.
- Soon all stakeholders are flabbergasted. How could this happen?!

Well it's clear, what happened is that the Board misinterpreted and neglected early warning signs and SRIs, resulting in a company meltdown.
How to prevent a melt down?To prevent a situation like the one above, the board should
- Set up a SRI-Register
- Order the RM-Department to include SRIs in their risk model
- Discuss the integral SRI-register monthly in the Board meeting
- Interprete the SRIs, and take proactive actions to prevent the SRIs from becoming critical. This is Board's Craftsmanship!
As continuity is a company's main goal, managing uncertainty is the Board's main responsibility.
Redefining RiskOnce we realize that Soft-Risks are crucial in Risk Management, how can we include them in our Integral Risk Model (IRM)?
First we'll have to re
define Integral Risk as follows:
(1) I-Risk = Integral Risk = Measurable Risk + Unmeasurable Risk
(2) I-Risk = Integral Risk = Hard Risk + Soft Risk
(3) I-Risk =
∑( Threat
j x Vulnerability
j x Cost
j ) +∑ E(SRI
i=1,2..n)
Keep in mind that the Integral Risk is not a number, as the SRL is not measurable. If you can't force your brain to '
quantum think' this way, just imagine the Integral Risk as the total company value (at stake).
Cleaning upFirst 'cleaning up' action we can do is to investigate the relationship (correlation, covariance matrix, etc.) between each past assumed Soft-Risk event and the Vulnerability of each Hard Risk event. This tells us probably something of the influence (correlation) of certain (combination of) SRIs on the traditional Hard Risk parameters.
Probably this research will show that some of the SRIs could even be defined as Hard Risk variables. Unfortunately this investigation -
as explained -won't tell us anything about the real unmeasurable Soft-Risks. The problem remains.....
Managing Soft-RiskThe real main problem is : If you can't measure Soft-Risk, how can you be sure your 'Soft-Risk Management' (SRM) is successful, as you can't measure the effects of your actions either?
This seems to be an insolvable problem. Insolvable because of what Bowman in fact calls our '
mono data mind set'.
We are not trained in taking decisions without data. As we are not trained, we become unsure. Unsure about the risk of the impact of our decision, that is unmeasurable as well. Full circle, we're back where we started.
However, there's a way out of this paradox, it's called
Principle Based Risk Management
Before we dive deep, let's first take a step back and have a look at two important actual developments, (1) the
Global Warming Problem and (2)
Solvency II.
(1) Global Warming ProblemDuring recent decades scientists have developed different global warming models that contradict each other. The real climate is far too complex to be modelled. We could spend millions of dollars on research to find the ideal model, we will never succeed!
Step by step the leaders of this world recognize that they'll have to manage the global warming in a different way. It's no longer important whether or not there exists a provable global warming problem. The main question is whether we are willing to live up to the principle: "
You don't foul your own nest"
This way of principle-based thinking requires reflection on the level of 'spaceship earth', on a 'global' level. However, simultaneously, it urges for acting in line on a 'local' level.
Although related with
The Precautionary Principle, Principle Based Risk Management is much more fundamental. It's an adequate tool for fighting Soft-Risks.
(2) Solvency IIIn our aim to strengthen the insurance industry solvency, implementation of Solvency II bears the a risk of an overshoot. Instead of managing risks first and in a better way, we translate every risk into
capital requirements, consequently increasing the cost of doing business and insurance premiums. It's the perfect example of putting the cart before the horse. Although we expect Solvency II measures to work out in a better solvency, in reality we don't know, as this 'capital-increase scenario' hasn't been tested before and can't be tested. The presumed positive effect could just as well be adverse.
In our aim to avoid risk, we've created another additional risk. A risk we can't measure (yet). Yes, unfortunately, Solvency II is a SRI as well.
Instead of making Solvency II obligatory, a far more effective Principle Based response from the Regulator would have been:
"Prove us that you manage your own risks"
Back to Soft-Risk ManagementIt's not that difficult managing Soft Risks Principle Based. In fact we all have experience with Soft Risk Principle Based decisions when we decided to have friendship, marry, or to have a child. Or did you
calculate the 'lifetime present value' of your child?
Try to apply the above principles in your own company or in your own department. Just start by investigating your Soft-Risk Indicators and start managing soft and hard risks Principle Based.
What principles can we formulate to manage Soft-Risk? Well actuarial folks.... that's food for another blog as this blog is getting far too long..... O.K. .... I wont keep you waiting, just one Principle Based one-liner that tackles a whole bunch of SRIs at once
Bonuses are only paid in case of
High Customer Satisfaction
Related (additional) Sources:-
Unmeasurable measures: The lawlessness of great numbers-
The Risk Equation-
An Additional Way of Thinking... :The Quantum Perspective -
From Principle Based Risk Management to Solvency Requirements-
Measuring the unmeasurable-
Managing Extraordinary Risk (2009, Towers Perrin)
-
Measuring the Unmeasurable: Balanced Scorecard-
NYT: Risk Mismanagement-
Backtesting Value-at-Risk Models (2009)-
Quality control of risk measures: backtesting VAR models-
Metrics: Overmeasuring Our Way to Management
 Whether you're an actuary, accountant, consultant or salesman, when we take up a new challenging project, we're inclined to spend most of our time on data mining, modeling, reconsidering, detailing, arguing, making things perfect and finally, drawing the conclusions and writing the exhaustive proposal report....
 The next day, at 14.00 AM you enter the Board room, full of confidence. Your presentation is start-ready, the beamer glows, you're fully concentrated on your audience and in a 'cashing' flow....
 With the help of Edraw, creating presentations and mind-mapping is a question of minutes.


 However, already in the 3rd century the


 LinkedIn Actuary-Info Group